Unemployment Data from FRED
Initialize
library(tidyverse)
library(fredr)
Getting the Data
Getting data official economic data from in R is a breeze. FRED (the St Louis Federal Reserve) has provided a handy API for getting data like unemployment.
Making this process even easier is the R package fredr which provides convenient wrappers for pulling data.
In order to get this data, you have to first get an API key from FRED. I have stored mine in the .Renviron file so I don’t accidentally share it when I publish my notebooks. Once you have set it up in your environment, you can use Sys.getenv() to set it locally and use it to pull data.
fred_key <- Sys.getenv('FRED_API_KEY')

fredr::fredr_set_key(fred_key)
Once you have set up your API key, you can use purrr::map_dfr to easily pull mutliple different series by their FRED code.
Here we have pulled four series:
UNRATE: overall unemployment rateUNEMPLOY: overall unemployment levelFLUR: Florida unemployment rateBOST625URN: Boston metro area unemployment rate
unemployment_data <- map_dfr(c("UNRATE","UNEMPLOY","FLUR","BOST625URN"),fredr::fredr)Visualize
Now that we have the data, we can visualize.
unemployment_data %>%

  # filer data
  filter(series_id %in% c("UNRATE","FLUR","BOST625URN")) %>%
  filter(date > as.Date("2007-01-01")) %>%

  # recode and arrange the different series variables
  mutate(series_id = recode(series_id, "BOST625URN" = "Boston",
                            "FLUR" = "Florida",
                            "UNRATE" = "USA")) %>%
  mutate(series_id = factor(series_id, levels = c("Boston","Florida","USA"))) %>%

  # plot the data
  ggplot(aes(x = date, y = value,
             color = series_id)) +

  geom_line(alpha = 0.7, size = 1.4) +
  scale_color_manual(values = c("#00C5CD", "#43CD80", "#EE4000")) +
  ggthemes::theme_fivethirtyeight() +
  labs(color = "", title = "Unemployment Rate") +

  # add shaded region for great recession
  annotate("rect",
           xmin = as.Date("2007-12-01"),
           xmax = as.Date("2009-06-01"),
           ymin = 0,
           ymax = 16,
           alpha = .2)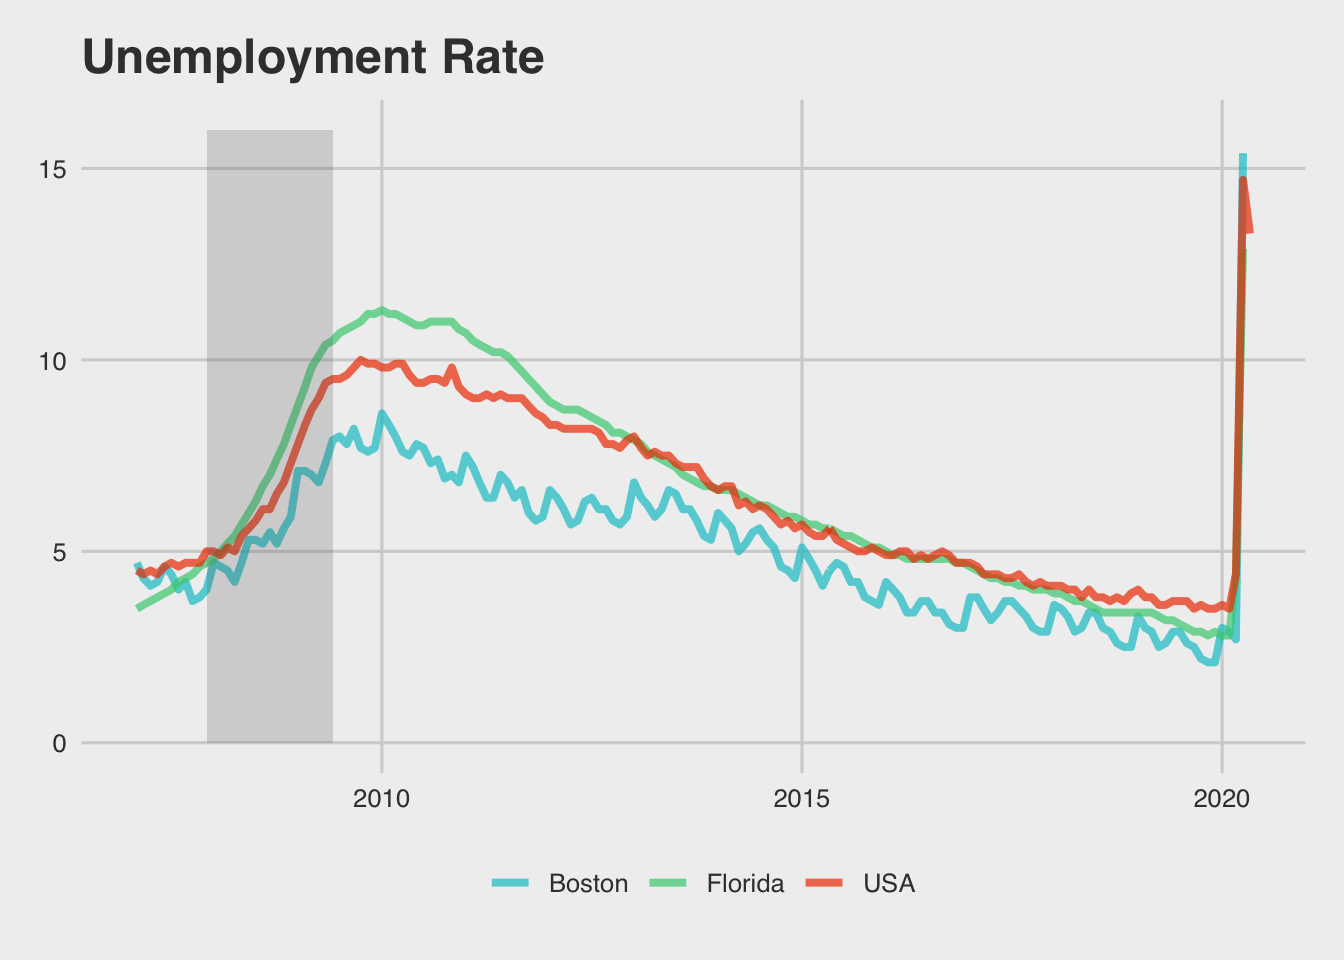
Kyle Thomas
VP, Quantitative Analyst II
I am a quantitative analyst focusing on valuation and marketing.